
 Tweet
Tweet
Smart Trades Inc.
Expert market forecasting services
Excerpts from recent newsletters:
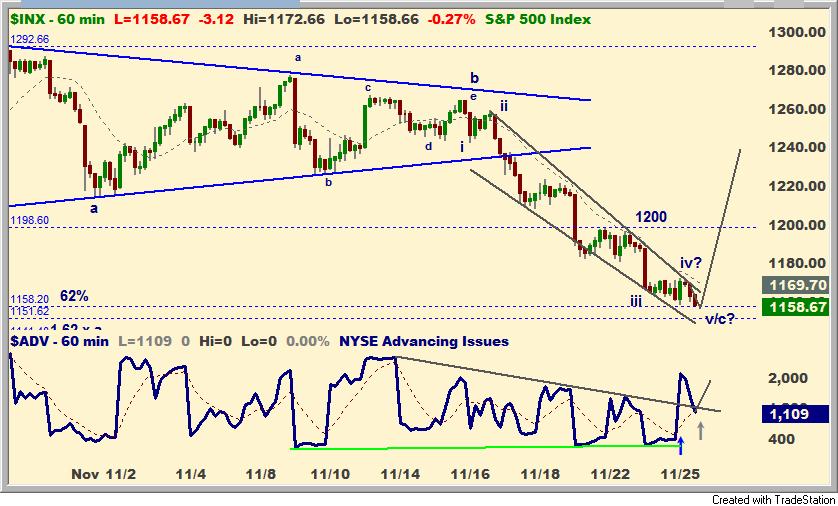
Smart Trades Update 11.27.11
On 11.17.11 I said:

"The 1150-1160 area basis the INX cash is a preliminary target zone."


And on Twitter Friday (11.25.11) before the close:

"Moderate new lows, with continued strong breadth, *and* a quick upside
reversal would be OK (likely at least a short term 5th wave low)."

"INX 1157 or so would be a "i=v" in the 1150-1160 zone."

The INX hit 1158.66 late Friday. The S&P futures are up about 24 points (2%) from there Sunday evening.
It's possible a short term low is in place, but we need to hold 1158 (typo said 1258) early this week and then clear
resistance near INX 1200. If we don't hold, next support is 1140 in the S&P and 2110-2120 in the
Nasdaq 100 (NDX).

Here's the chart from Twitter updated through Friday's close:
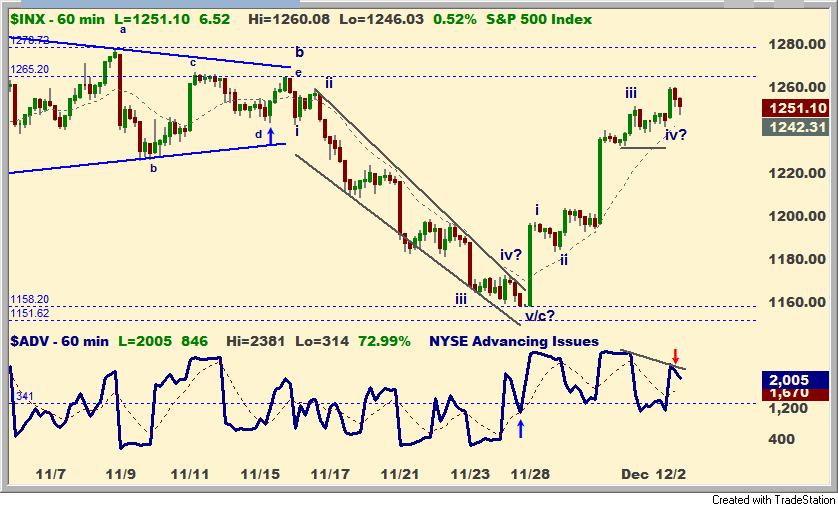
Here's what happened as of 12.2.11 around 9:15 AM PST along with the count at that time:
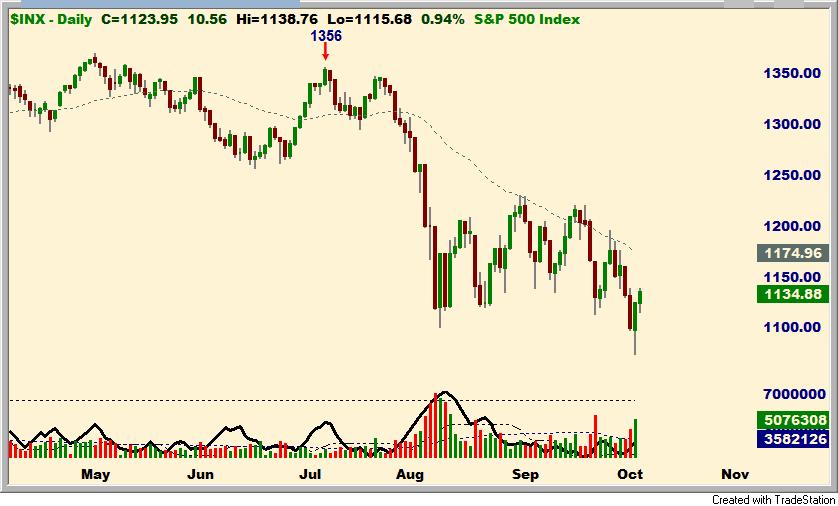
Smart Trades Update 10.4.11
We have a possible short term reversal pattern to the upside, but the stock market is not out of the woods yet.
Basis the INX cash we have dipped under the August lows (1101) early today, and as I write we are testing that
area from below. A strong close above 1101 favors a short term bounce and leaves potential for another test of
the mid 1200's. A failure to close above 1101, or worse a break of 1074, points potentially down to INX 1000:
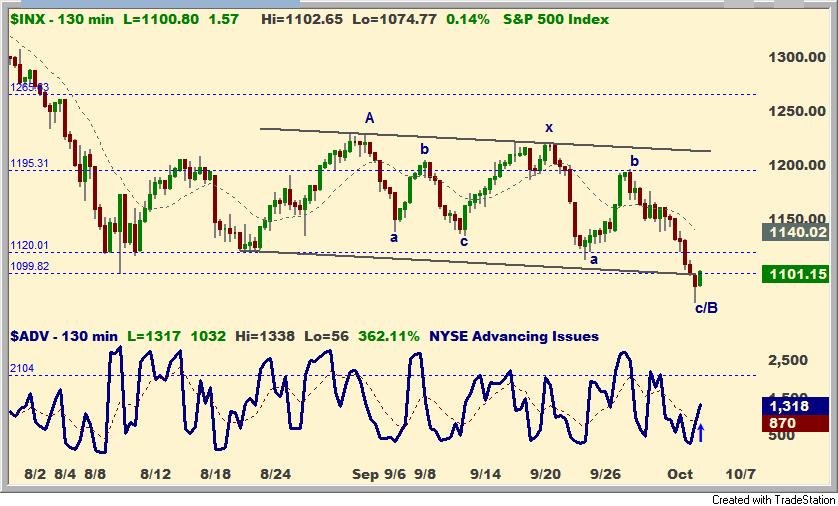
S&P as of 10.5.11:

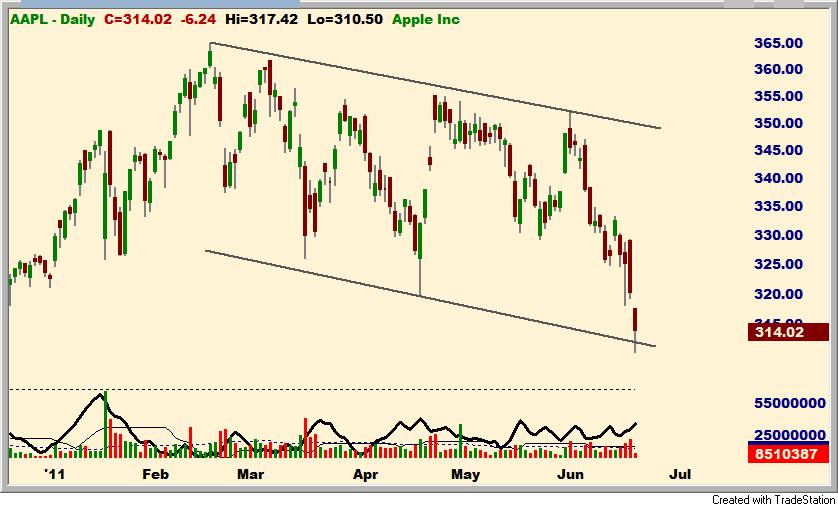
6.16.11:
Finally, Apple has broken its triangle pattern. This tends to
make me favor the
expanded flat count for the broader market as well. The lower trend
line of the
bull flag pattern will intersect with the rising long term trend
line near 315. A
solid break of 300-315 in Apple would make me reconsider this
pattern for both
AAPL and the broader market. Please note volume and momentum are
both
waning on the decline (so far) which is consistent with a
corrective decline:
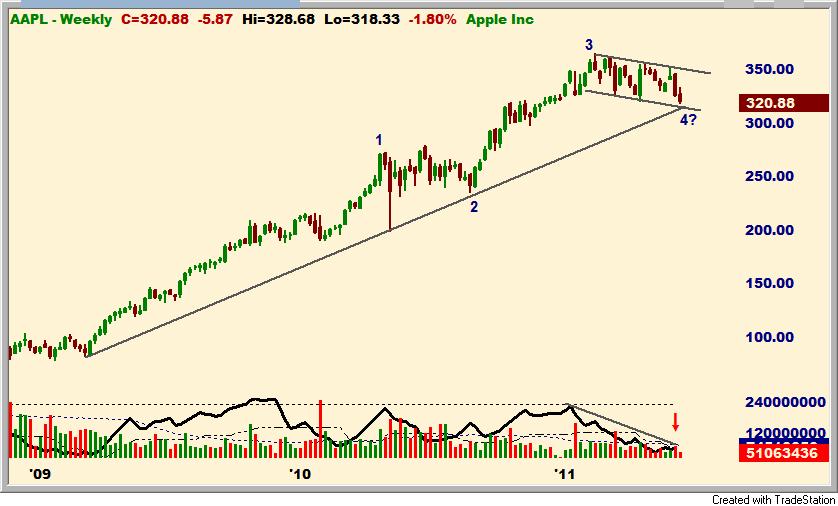
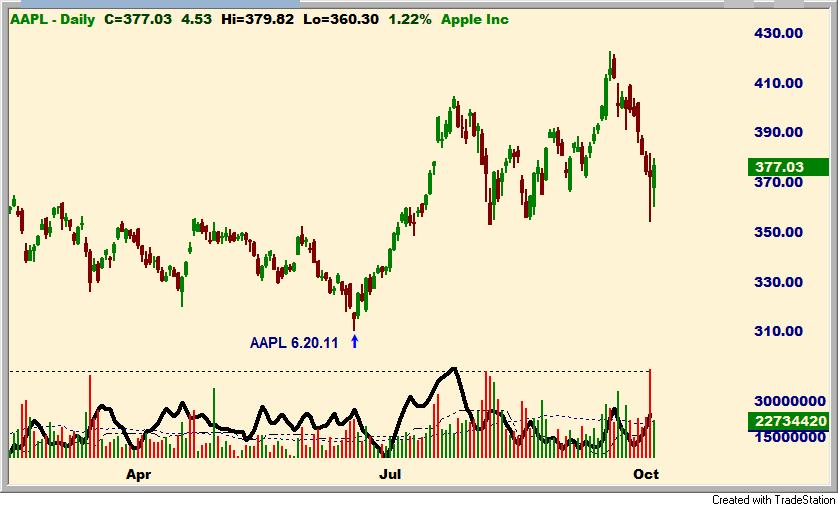
Apple 6.20.11:
Apple on 10.5.11:
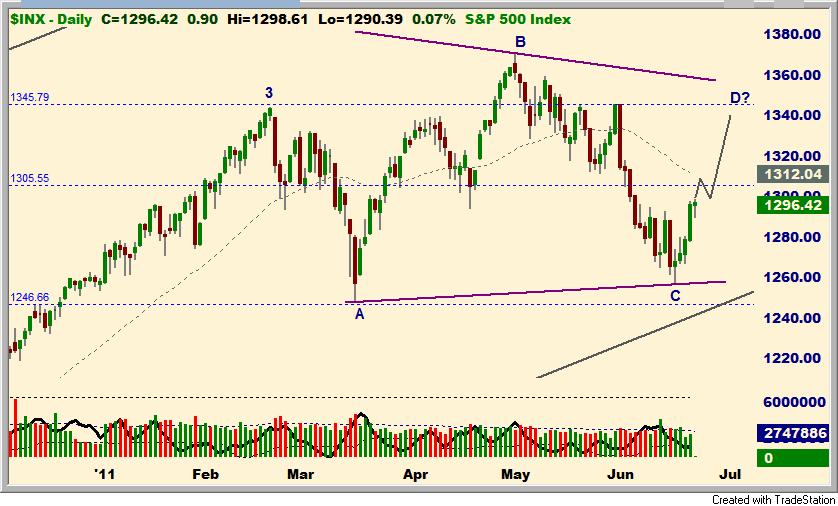
Smart Trades Update 6.22.11
The stock market is leaving its options open. Short term the S&P
held the lower
extreme of where a triangle needs to hold. If that's the case the
INX could rally to
the 1340-1350 area in "D" of a large contracting triangle:
S&P peaked near 1356:
Monthly Subscription $49
This post is for educational purposes only.
TRADE AT YOUR OWN RISK!
All Charts & Quote Pages in this publication made with Omega Trade Station (r) 8
NOTICE: Traders can and do lose money. No claims are made that the information provided here will insure gains or prevent loses.
NOTICE: Neither the information, the systems, nor any opinion expressed herein constitutes a representation by Smart Trades Inc., or a solicitation for the purchase or sale of any commodity futures, or options of any kind. Those using the information and systems herein for trading purposes are responsible for their own actions and no claim is made that the recommendations or systems will be profitable or that they will not result in losses. Smart Trades owners, employees, or members of their families may have a position in the markets contrary to the information or systems contained herein.
PLEASE NOTE THAT THERE IS AN INHERENT RISK OF LOSS ASSOCIATED WITH TRADING FUTURES, STOCKS AND OPTIONS CONTRACTS, EVEN WHEN USED FOR HEDGING PURPOSES. PLEASE CAREFULLY CONSIDER YOUR FINANCIAL CONDITION BEFORE INVESTING IN FUTURES AND OPTIONS CONTRACTS. FUTURES AND STOCK TRADING IS NOT SUITABLE FOR ALL INVESTORS. NO CLAIMS ARE MADE THAT THE INFORMATION PROVIDED HERE WILL INSURE GAINS OR PREVENT LOSES.
TRADE AT YOUR OWN RISK.
PAST PERFORMANCE IS NOT NECESSARY INDICATIVE OF FUTURE RESULTS.