
 Tweet
Tweet
Smart Trades Inc.
Expert market forecasting services
Smart Trades Update 7.26.11
(Originally sent out at 10:54 AM Pacific Time on 7.26.11)
Stocks continue to plod along and leave their options open, however there are bearish warning
signs short term.
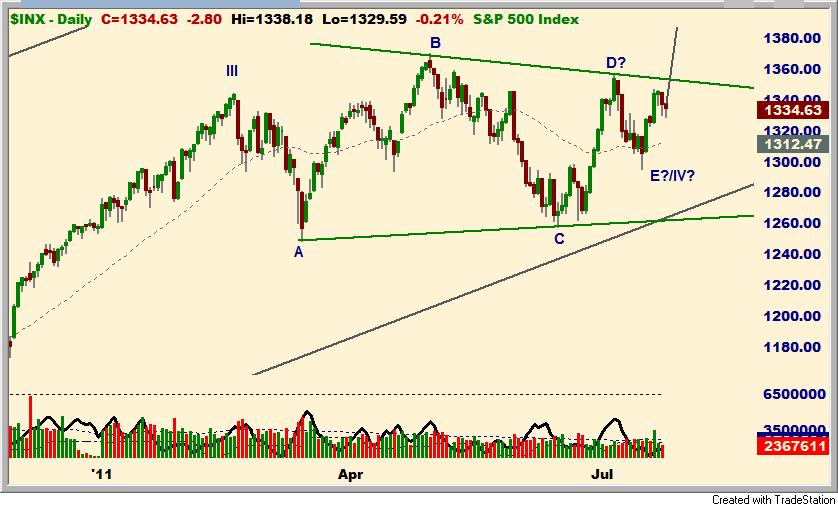
First let's cover the alternate bullish scenario. The big picture from the February peak is that
the S&P has been in a sideways correction. Indeed, as I write, we are at 1336 or so. That's
down about eight points from the February peak (a little over .5% net movement in five months).
The main message again is that the move from February is corrective and ultimately should be
resolved to the upside. Moreover, that correction *may* have ended on July 18th at INX 1296.
*If* that's the case, new highs could happen very soon, perhaps in the next few days:
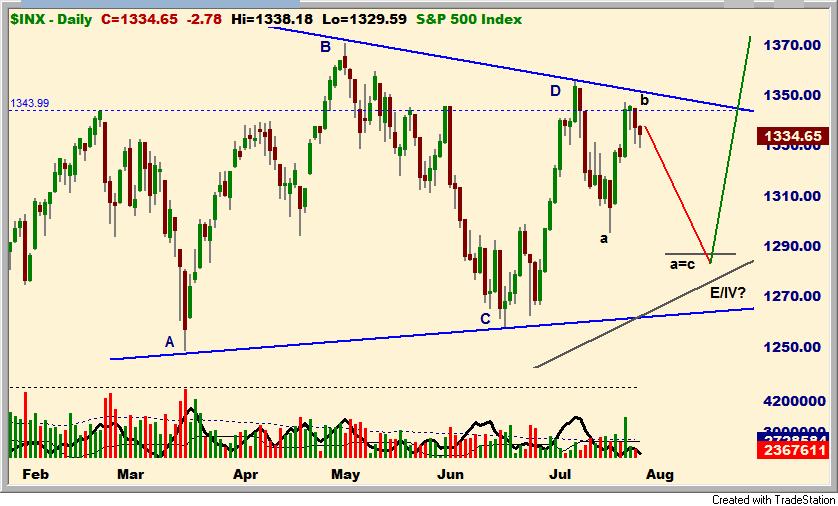
I still favor a more bearish short term pattern. I suspect Washington will accommodate New York and
try to scare stocks out of the weak hands before taking the markets higher. This allows for "bad news",
a panic down to 1280-1290, "good news", and a bottom, and then we get our rally to new highs.
Beware however! They may screw it up. A break of 1250 kills the pattern as does a rally above 1360:
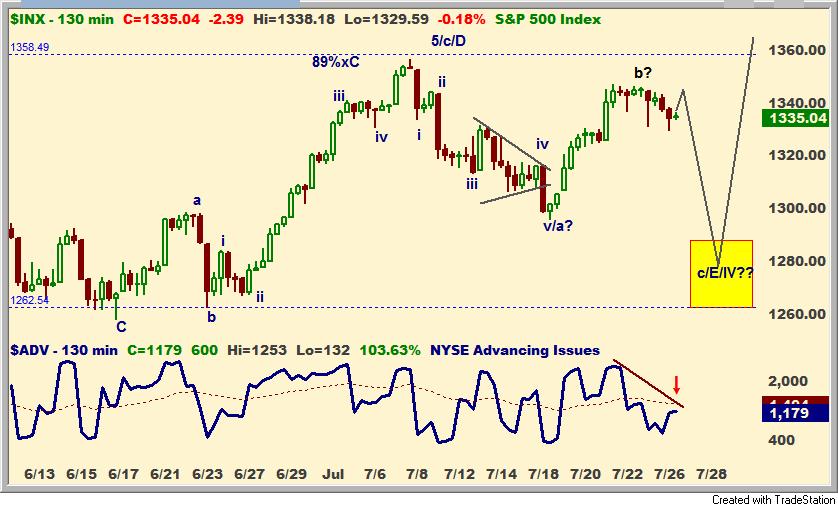
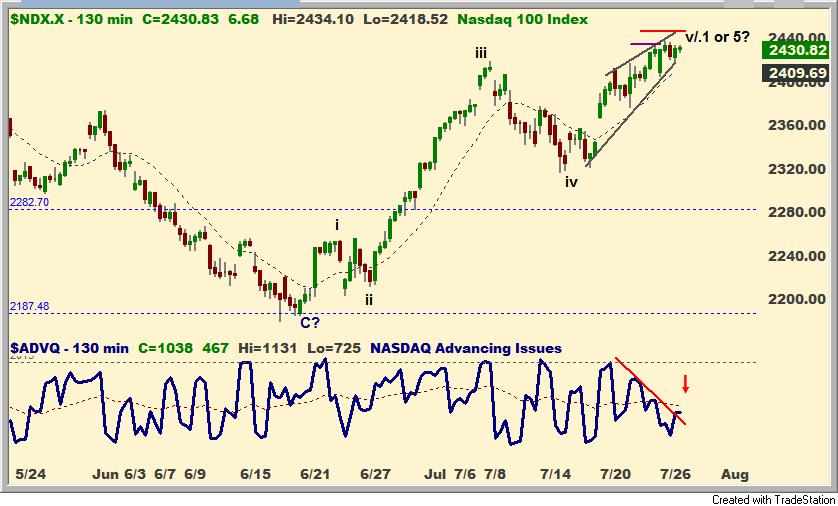
Here's a bit more detail on the 130 minute chart. I use 130 minutes as it's an even three bars a day on
the cash indices. Please note breadth ratios are still negative basis NYSE advances:
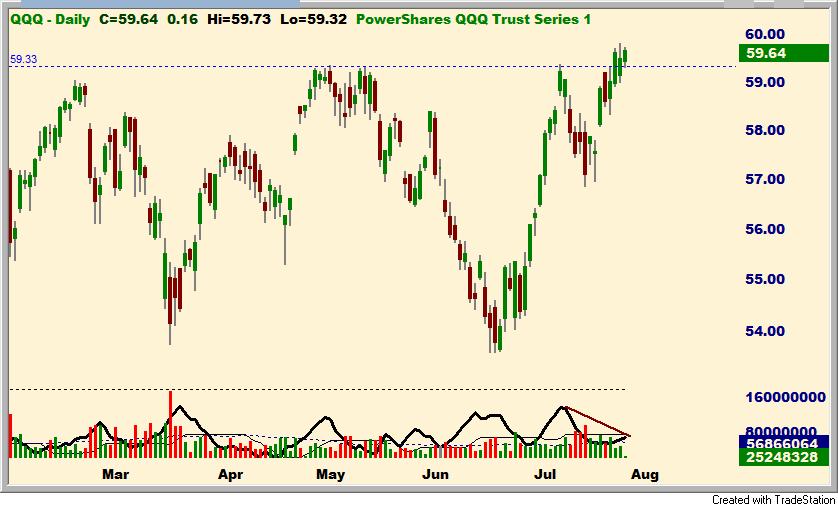
The Nasdaq has already made new highs and so far is holding them (that's bullish). But (there always
seems to be a but) volume and momentum are weak. If the Q's (shown here) can rally on improving
volume it may be off to the races. A failure to hold on, and a break of 58.90 or so, points down to 56.90
or possibly lower:
So far the rally looks even weaker when we look more closely. We can count a potentially terminal
five waves up already. Moreover, the internal pattern of "v" can be counted as a terminal wedge.
Nasdaq breadth is very weak lately. The last segment up ("v") is 1.62 x "i" and .62 x "iii" in the 2440
area +/- 5 points. These are classic Elliott Wave ratio targets. The 2445 area coincides with the top
of the wedge. I would sell a failure into that area:
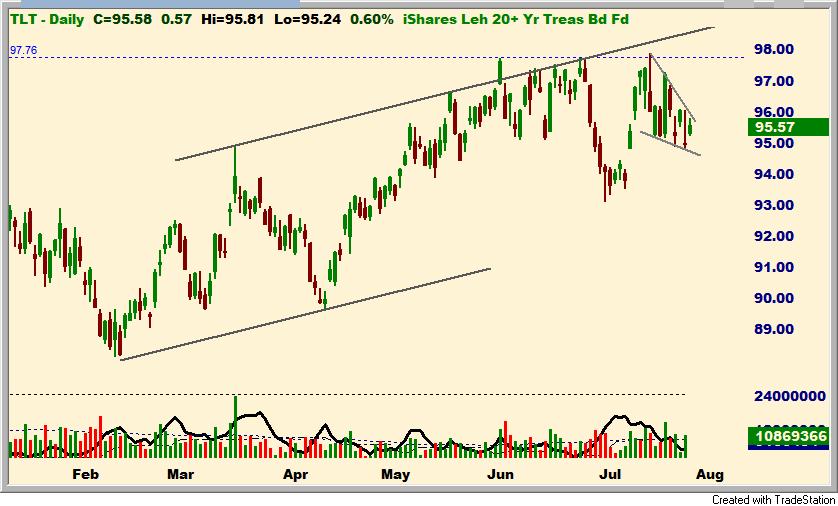
Bonds are moving sideways to lower. So far the decline may be counted as corrective. We may get another
upside pop:
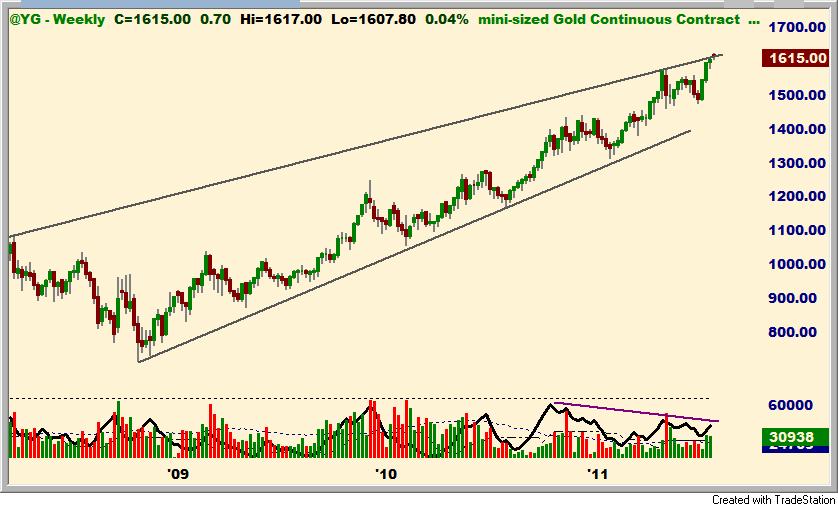
Gold has made another moderate new high:
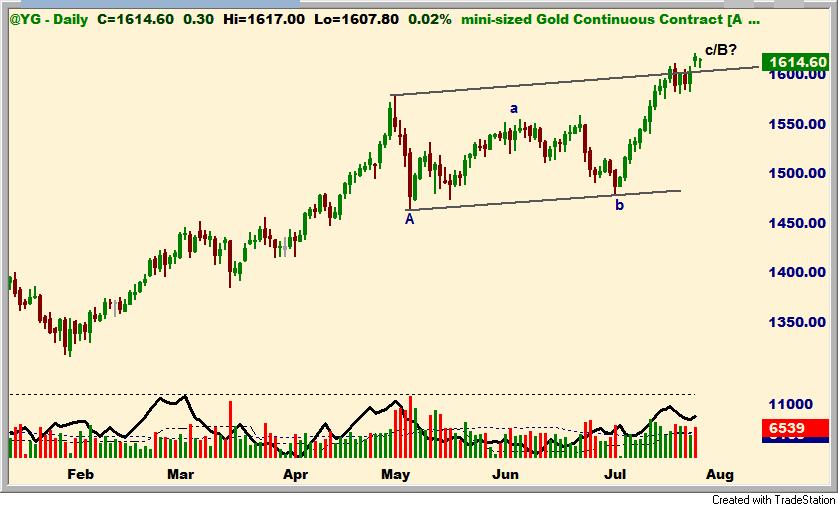
It may move higher yet, but it's worth noting it's up against the top of a very long term channel:
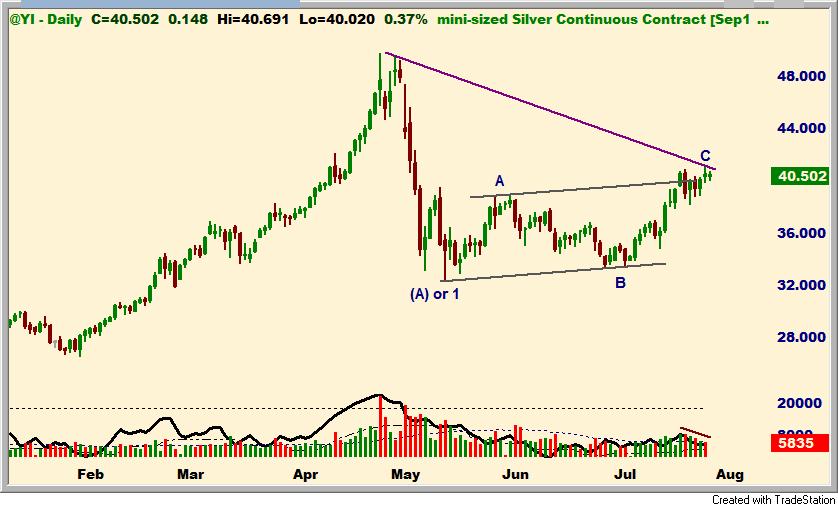
Also, although Silver has rallied short term, it's no where near confirming a new high. Rarely does
Gold continue to explode without Silver's company:
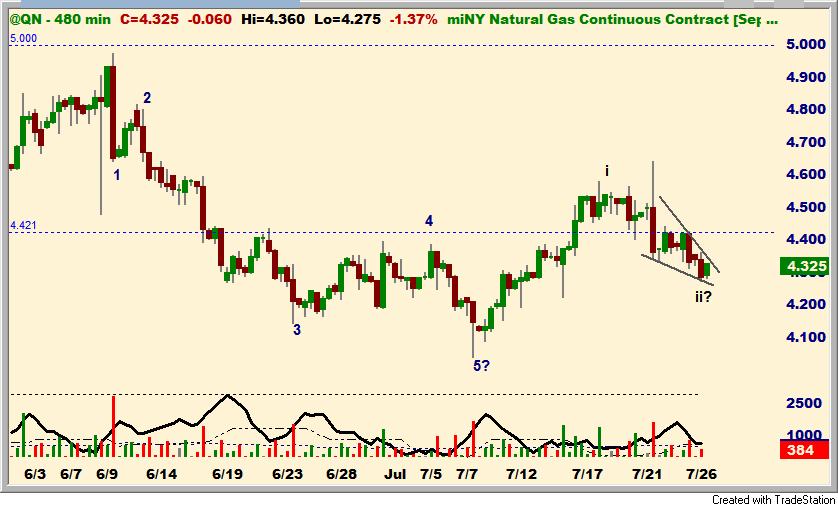
Natural Gas looks to have an impulse up ("i") and a correction down ("ii"). It may be a buy soon if
it holds 4.20 or so:
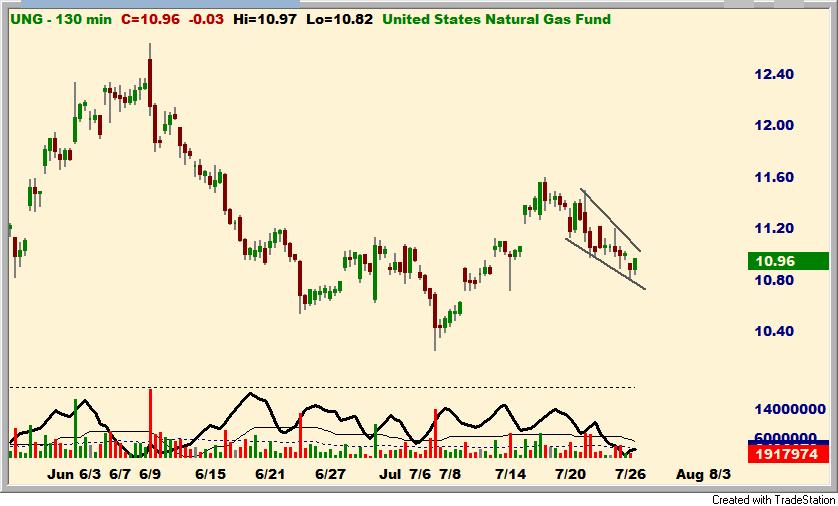
UNG needs to hold 10.26:
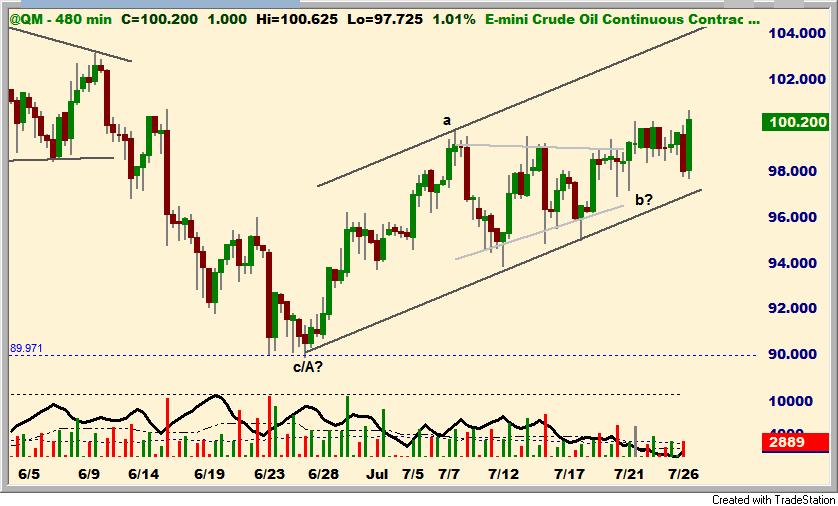
Crude is working higher, but it still looks corrective. Higher prices are likely short term as long as
96 holds:
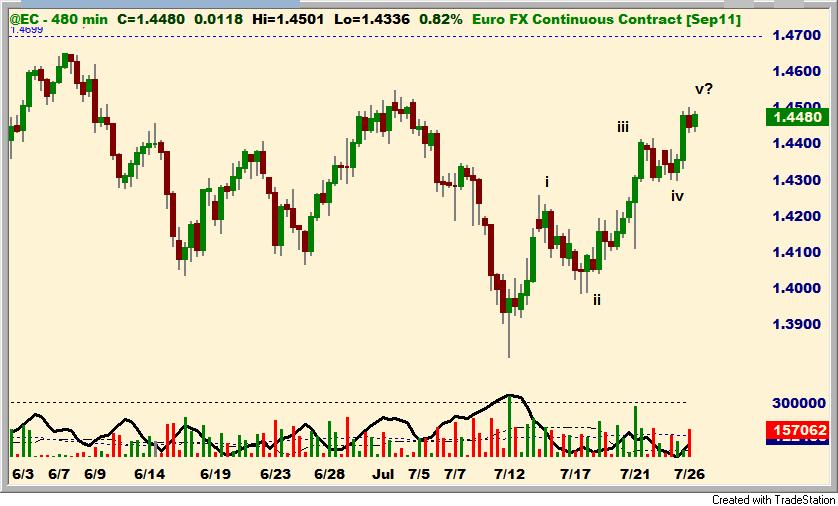
The Euro FX looks like it's got higher to go intermediate term, but may be near a short term peak. Resistance
stretches from 1.45 to 1.47:
TRADE AT YOUR OWN RISK!
NOTICE: Traders can and do lose money. No claims are made that the information provided here will insure gains or prevent loses.
TRADE AT YOUR OWN RISK.
NOTICE: Neither the information, the systems, nor any opinion expressed herein constitutes a representation by Smart Trades Inc., or a solicitation for the purchase or sale of any commodity futures, or options of any kind. Those using the information and systems herein for trading purposes are responsible for their own actions and no claim is made that the recommendations or systems will be profitable or that they will not result in losses. Smart Trades owners, employees, or members of their families may have a position in the markets contrary to the information or systems contained herein.
PLEASE NOTE THAT THERE IS AN INHERENT RISK OF LOSS ASSOCIATED WITH TRADING FUTURES, STOCKS AND OPTIONS CONTRACTS, EVEN WHEN USED FOR HEDGING PURPOSES. PLEASE CAREFULLY CONSIDER YOUR FINANCIAL CONDITION BEFORE INVESTING IN FUTURES AND OPTIONS CONTRACTS. FUTURES AND STOCK TRADING IS NOT SUITABLE FOR ALL INVESTORS. NO CLAIMS ARE MADE THAT THE INFORMATION PROVIDED HERE WILL INSURE GAINS OR PREVENT LOSES.
TRADE AT YOUR OWN RISK.
PAST PERFORMANCE IS NOT NECESSARY INDICATIVE OF FUTURE RESULTS.
Monthly Subscription $49
All sales are final and there are no refunds for the current billing period. You can cancel for the next billing period at any time. Annual cancellations within 90 days are prorated at the monthly rate. No refunds for the annual subscription after 90 days. Smart Trades Inc. makes no claims of profitability. Trade at your own risk.
TRADE AT YOUR OWN RISK!
No claim is made that the recommendations or systems will be profitable or that they will not result in losses.